|
Introduction The House >> Live data >> Efficiency Monitoring >> (Web Energy Logger) >> (WEL Store) The Land Wildlife About Us Podcast Info Links (Resources) Books |
|
Construction Pics Foundation Radiant Slab Acid Stain floors Ground Loop Wood Framing Mechanical Equipment Room Monitoring System Exterior Interior |
|
Mission Statement Earth (Sheltering) Sun (Passive Solar) Water (Geothermal) >> Efficiency test |
|
Design Process Timeline Goals Room Guide Concepts Preliminary 3D Model Final Design Download Plan |
|
Energy Mgmt. GREEN HVAC Energy Logger The Weather |
|
Phil's Other Stuff Marsupials GEARS SUGO Resume |
Trend Graphs for my Geothermal HVAC system.
View this page in conjunction with my Real-Time monitoring page.
Live environment diagram. Updated once a minute.

Interior Zone Temperatures (T1-T4).
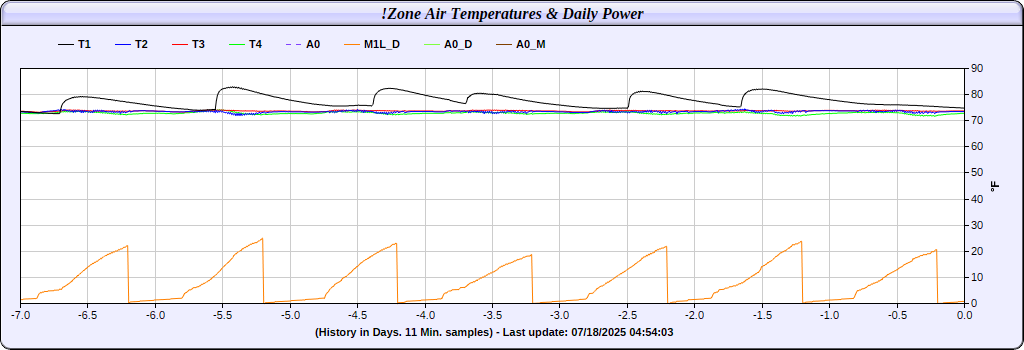
Black-T1: Garage,
Blue-T2: Office,
Red-T3: Living Room,
Green-T4: Master Bed.
Violet-A0: Outside Air Sensor.
Orange-P3: Daily accumulated Power Usage (KWH)
Utility power load in Real Watts (P2).
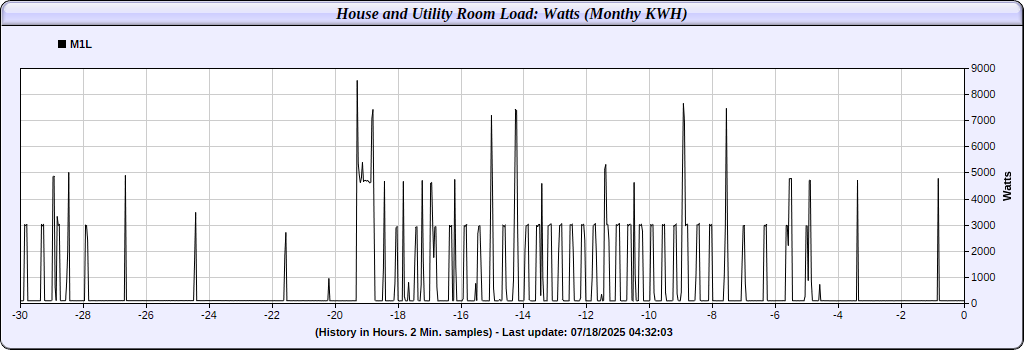
This chart measures the combined power draw from the Utility Room. Typical loads are:
Baseline (50W), ERV (60W), Well Pump (1.8KW), Lighting (360W),
W-A GSHP (3KW), W-W GSHP (3-4KW), Slab Circulators (70W ea),
Radiant Heat Zone Supply/Return (S2/6,3/7,4/8 & S5/9).
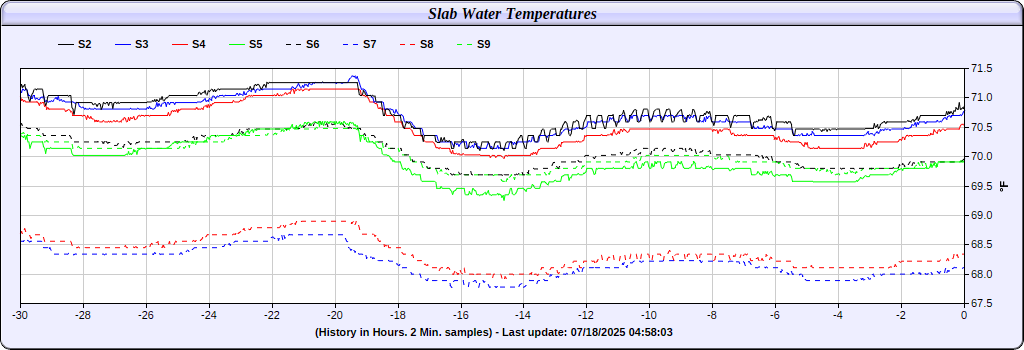
These are the radiant slab loop manifold temperatures. Solid Lines are floor supply, Dashed lines are returns.
Black-S2,6: Garage,
Blue-S3,7: Office,
Red-S4,8: Living Room,
Green-S5,9: Master Bed.
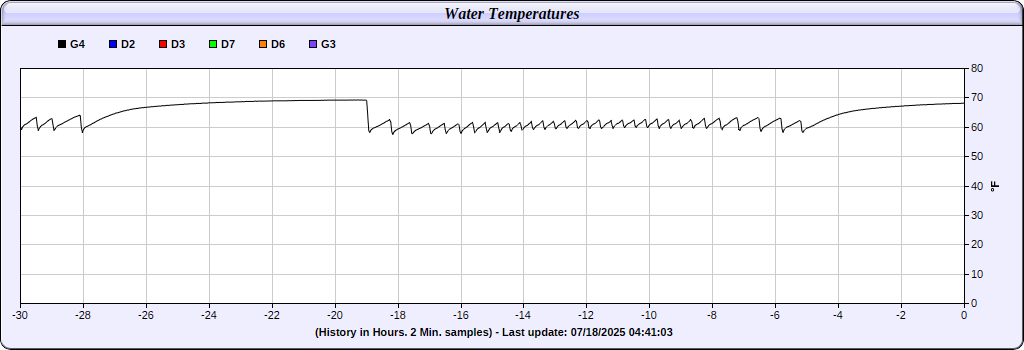
Blue-D2: GSHP Load In, Red-D3: GSHP Load Out,
Green-D7: Upper Tank Temp., Orange-D6: Lower Tank Temp.
Black-G4: GSHP Src In. Violet-G5: GSHP Src Out.
Ventilation Air Temperatures. (A1,2,5,6)
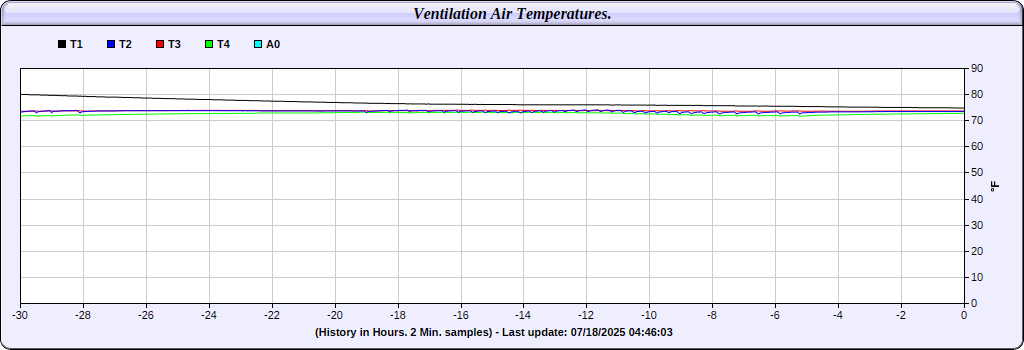
Blue-A1: Outside Air entering the ERV.
Cyan-A2: Outside Air leaving the ERV.
Magenta-A5: Inside Air entering the ERV.
Red-A6: Inside Air leaving the ERV.
Black-A0: Outside Air
|
||
| Designation | Media | Explanation | Valid and Meaningful |
| D1 | Water | Fresh drinking water from the artesian well. | When hot or cold water is being used in the house. |
| D2 | Water | Water from the Storage tank going to be heated in the W-WHP. | When the W-WHP is running. |
| D3 | Water | Water from the W-WHP being returned to the Storage Tank. | When the W-WHP is running. |
| D4 | Water | Domestic Hot Water from the Storage Tank. | When either DHW is being used in the house, OR, when one or more radiant slab zones is active. |
| A0 | Air | External Air Temp Sensor | All the time. |
| A1 | Air | Fresh Air from outside the house being passed into the Energy Recovery Ventilator (ERV) | When ERV is running. |
| A2 | Air | Fresh air leaving the ERV after exchanging energy with the stale exhaust air. | When ERV is running. |
| A5 | Air | Stale air from the bathrooms and laundry being sent to the ERV for energy capture. | When ERV is running. |
| A6 | Air | Stale air being exhausted to the outside after exchanging energy with the incoming fresh air in the ERV. | When ERV is running. |
|
An exercise in Energy Smart, Not So Big living. www.OurCoolHouse.com - Ideas |
This site is all about building a cool, energy efficient house, that makes maximum use of earth sheltered design, passive solar heating and cooling, geothermal exchange energy management, and right sizing of the house for it's designated use. The home's placement is on a south-facing hillside in Deep Creek Lake, Maryland. This site describes the design process, the technologies used and the expected results. We also have a comprehensive Links Page for anyone who is also interested in designing a similar project.